
diff options
| author | Christian Cleberg <[email protected]> | 2024-07-08 20:31:42 -0500 |
|---|---|---|
| committer | Christian Cleberg <[email protected]> | 2024-07-08 20:31:42 -0500 |
| commit | 415df61fd7b1f6b3d10a4a81cc4ece777a8a2c8f (patch) | |
| tree | 5291dff815cf5888992a18702bb1b7f5bb421d3a /content/blog/2024-01-27-tableau-dashboard.md | |
| parent | 29a31615690f9307eb19152e4d75248e7afdf854 (diff) | |
| download | cleberg.net-415df61fd7b1f6b3d10a4a81cc4ece777a8a2c8f.tar.gz cleberg.net-415df61fd7b1f6b3d10a4a81cc4ece777a8a2c8f.tar.bz2 cleberg.net-415df61fd7b1f6b3d10a4a81cc4ece777a8a2c8f.zip | |
fix images for 2023 and 2024 posts
Diffstat (limited to 'content/blog/2024-01-27-tableau-dashboard.md')
| -rw-r--r-- | content/blog/2024-01-27-tableau-dashboard.md | 15 |
1 files changed, 0 insertions, 15 deletions
diff --git a/content/blog/2024-01-27-tableau-dashboard.md b/content/blog/2024-01-27-tableau-dashboard.md index 2f1e73d..3fa0d50 100644 --- a/content/blog/2024-01-27-tableau-dashboard.md +++ b/content/blog/2024-01-27-tableau-dashboard.md @@ -90,24 +90,15 @@ anything private. After creating an account, you can click the `Create` > `Web Authoring` link to create your first visualization. -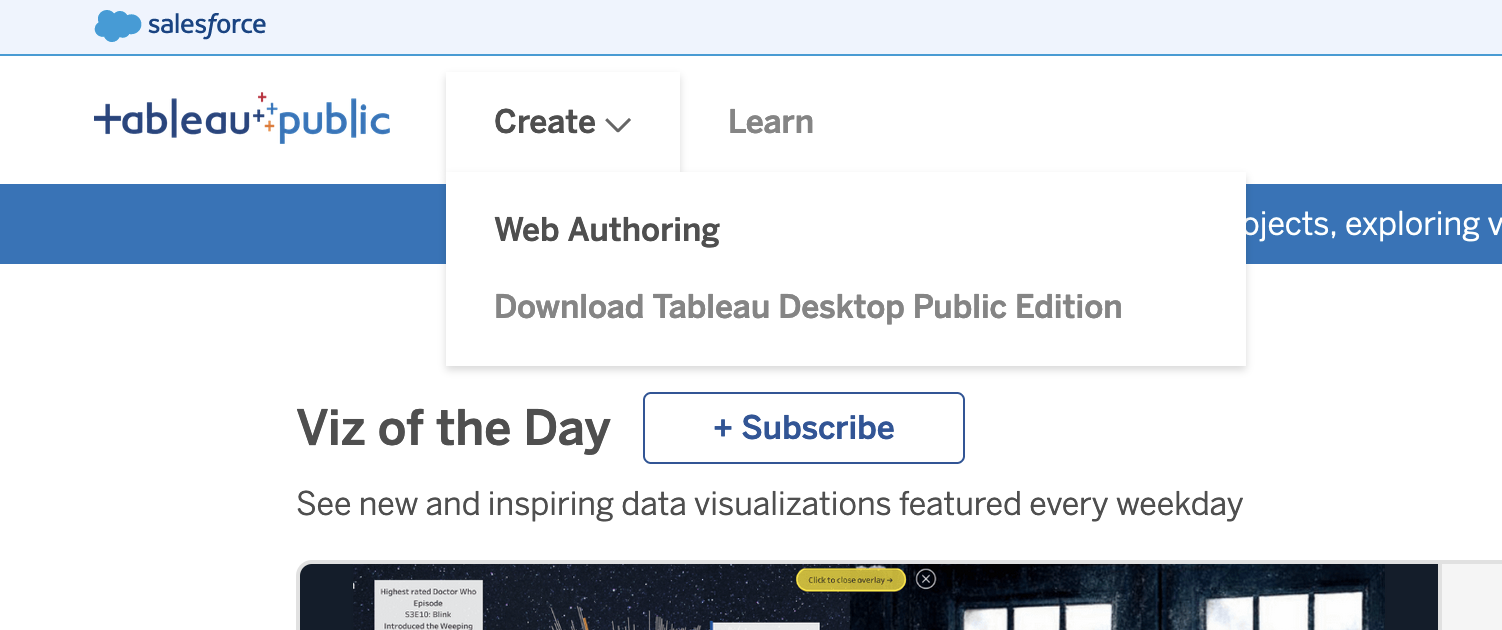 - ## Upload the Data Once you've opened your first project, Tableau will ask you to connect to your data. For this project, click the `Upload from computer` button and select the CSV file previously combined in the step above. -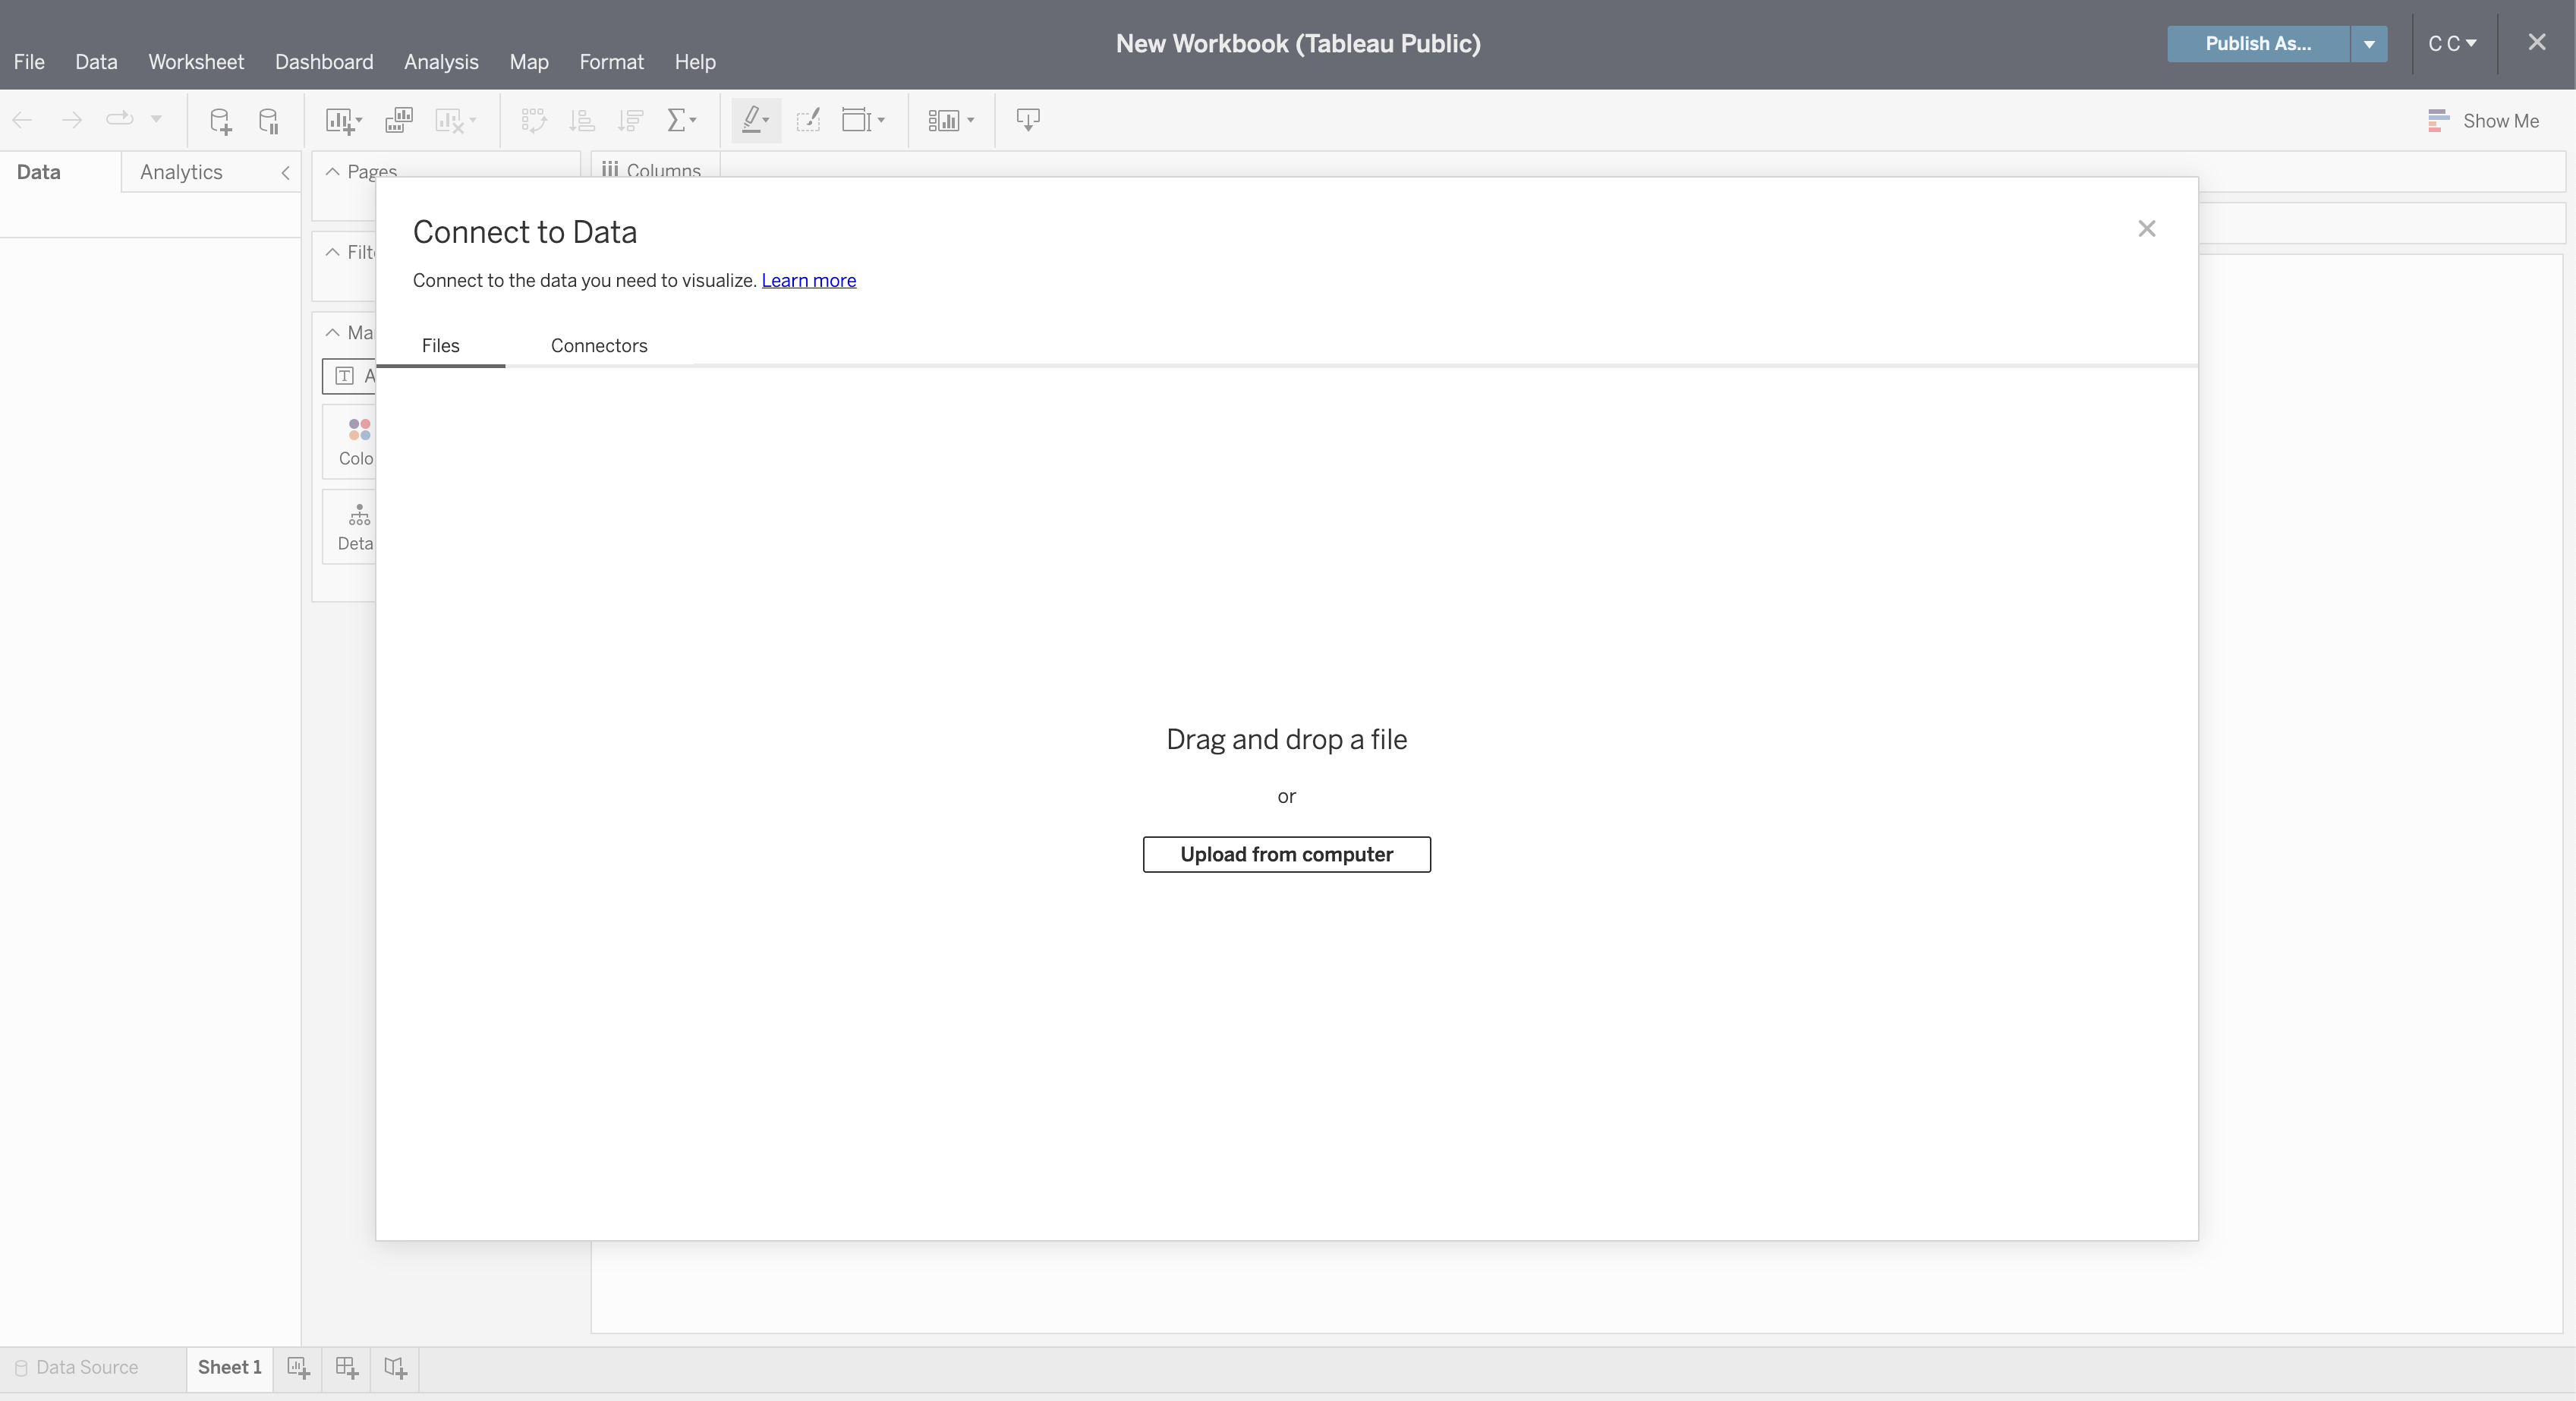 - Once connected, you can refresh the preview of the data with the `Refresh Data Source` button in the toolbar. -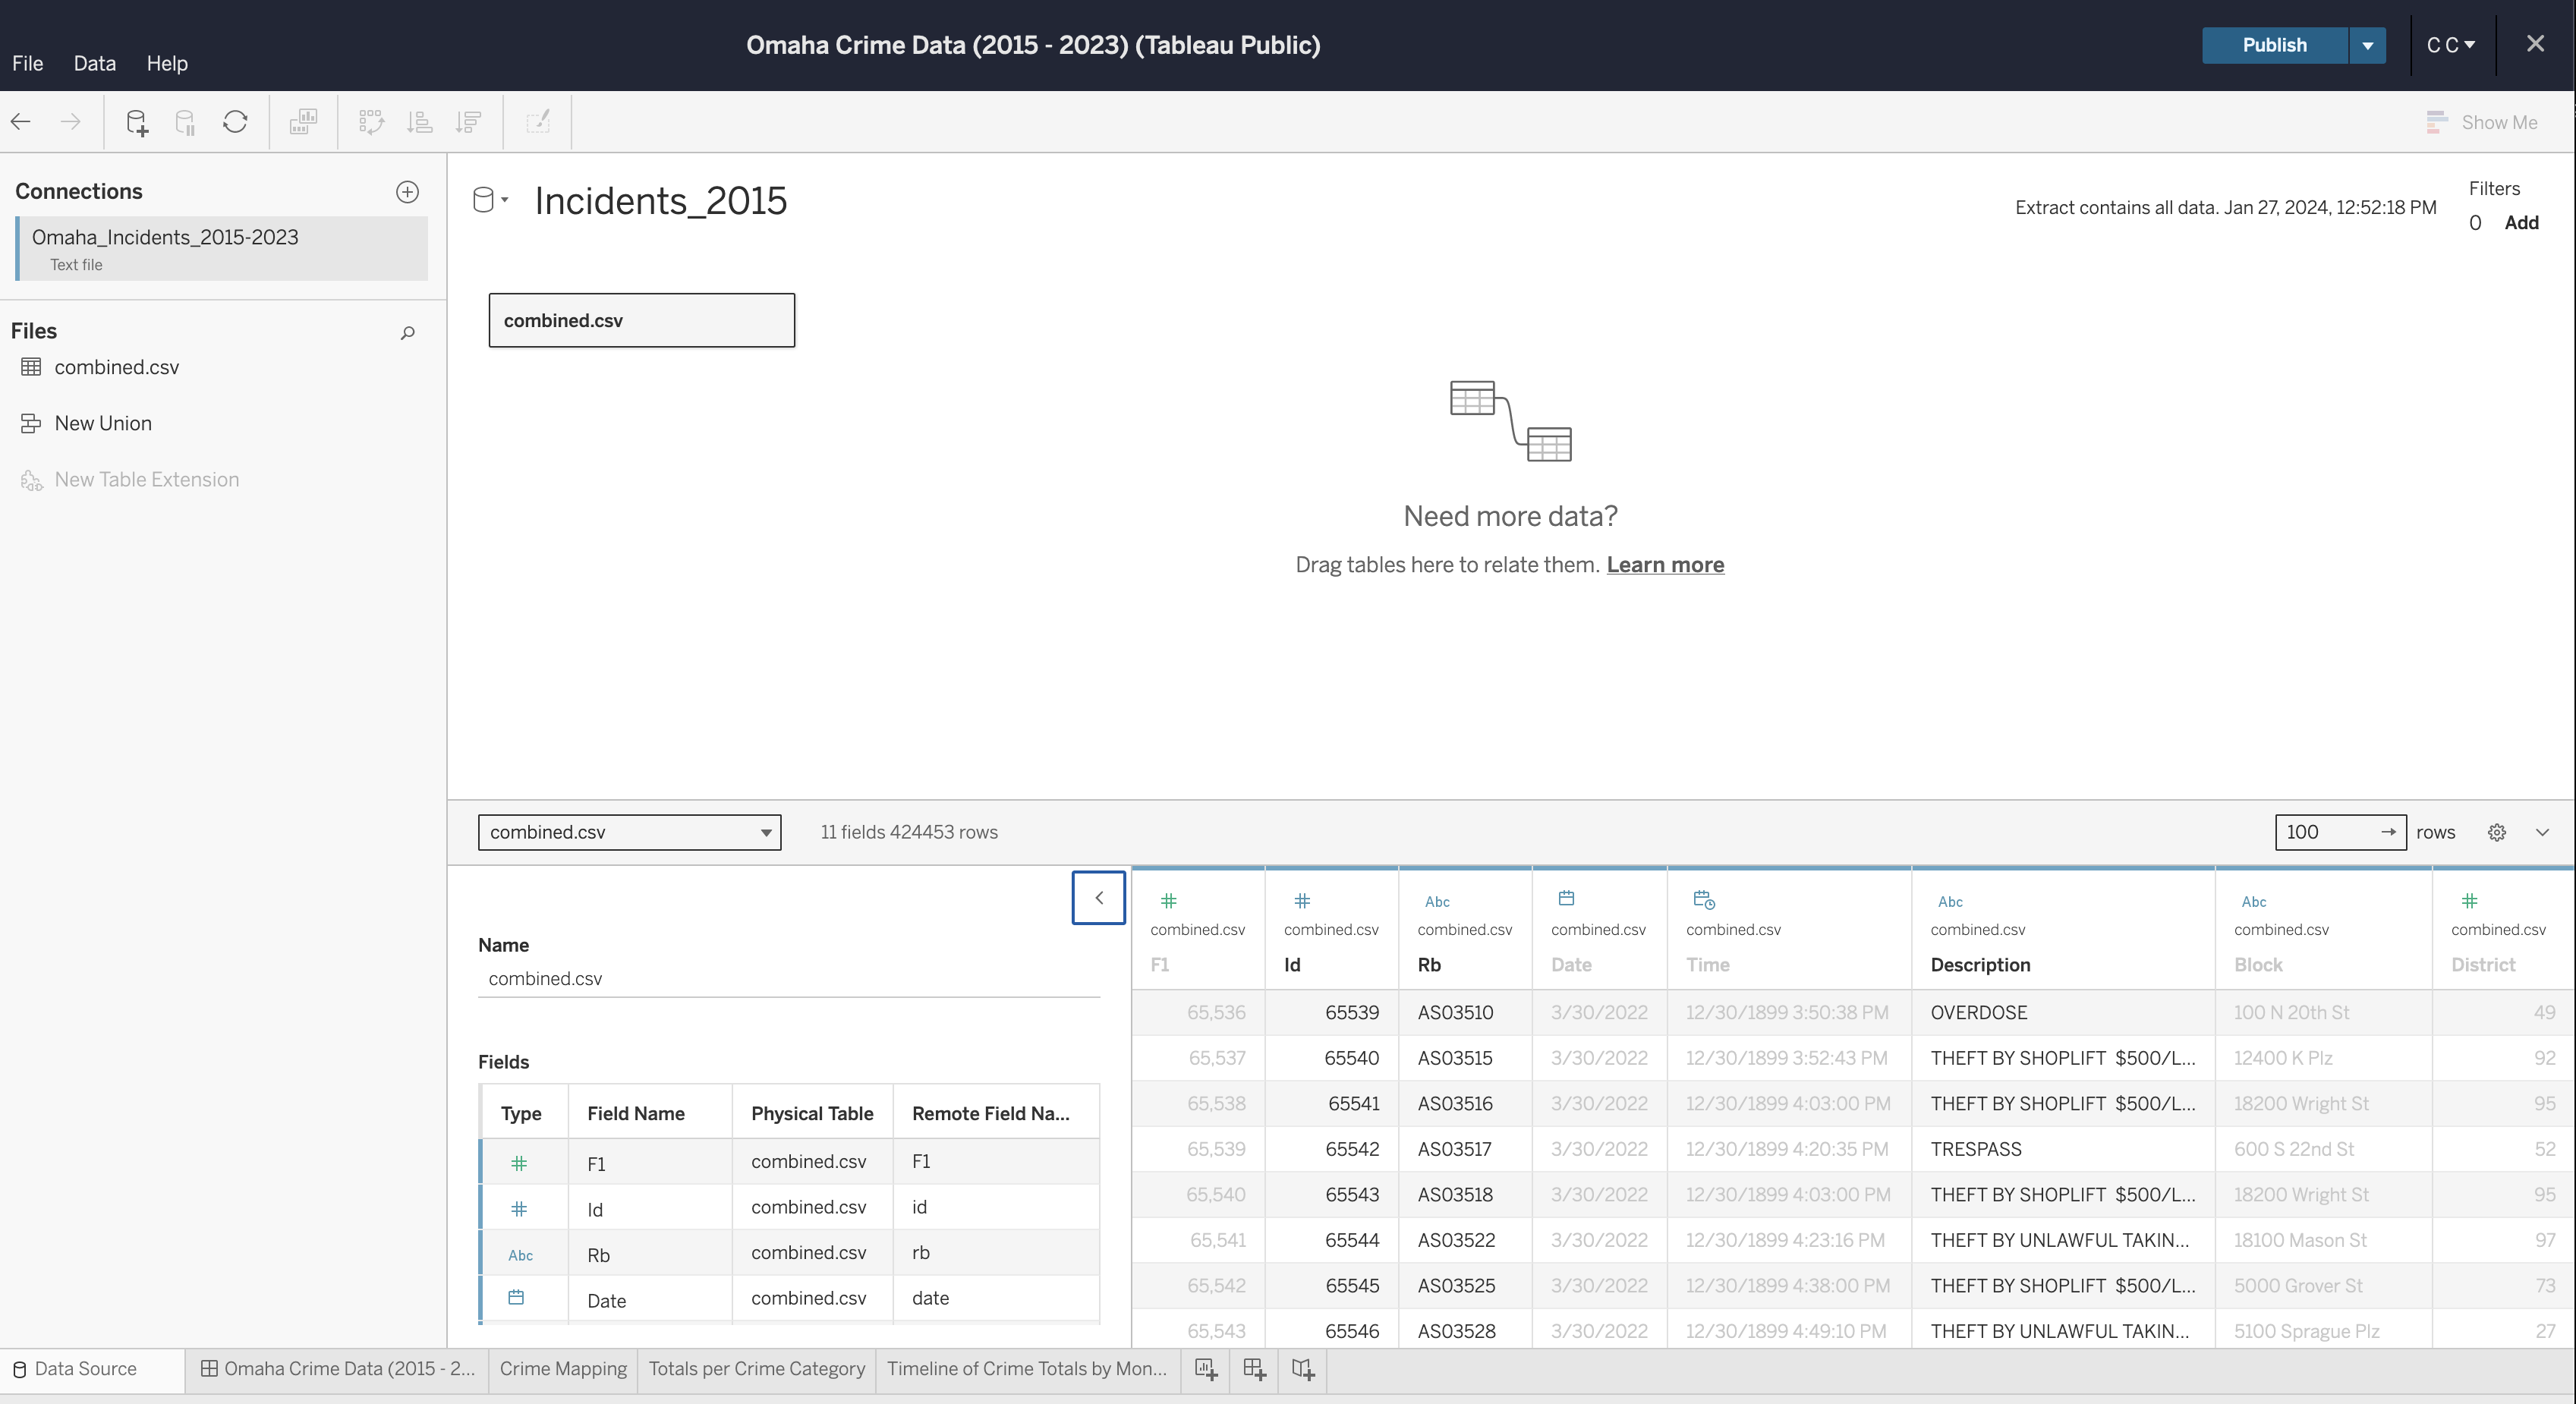 - If you need to edit any of the data types, column names, etc., you can do so now. Once complete, generate an extract so that you can start creating visualizations. @@ -129,9 +120,6 @@ following fields: - Datetime - `Filters`: Datetime -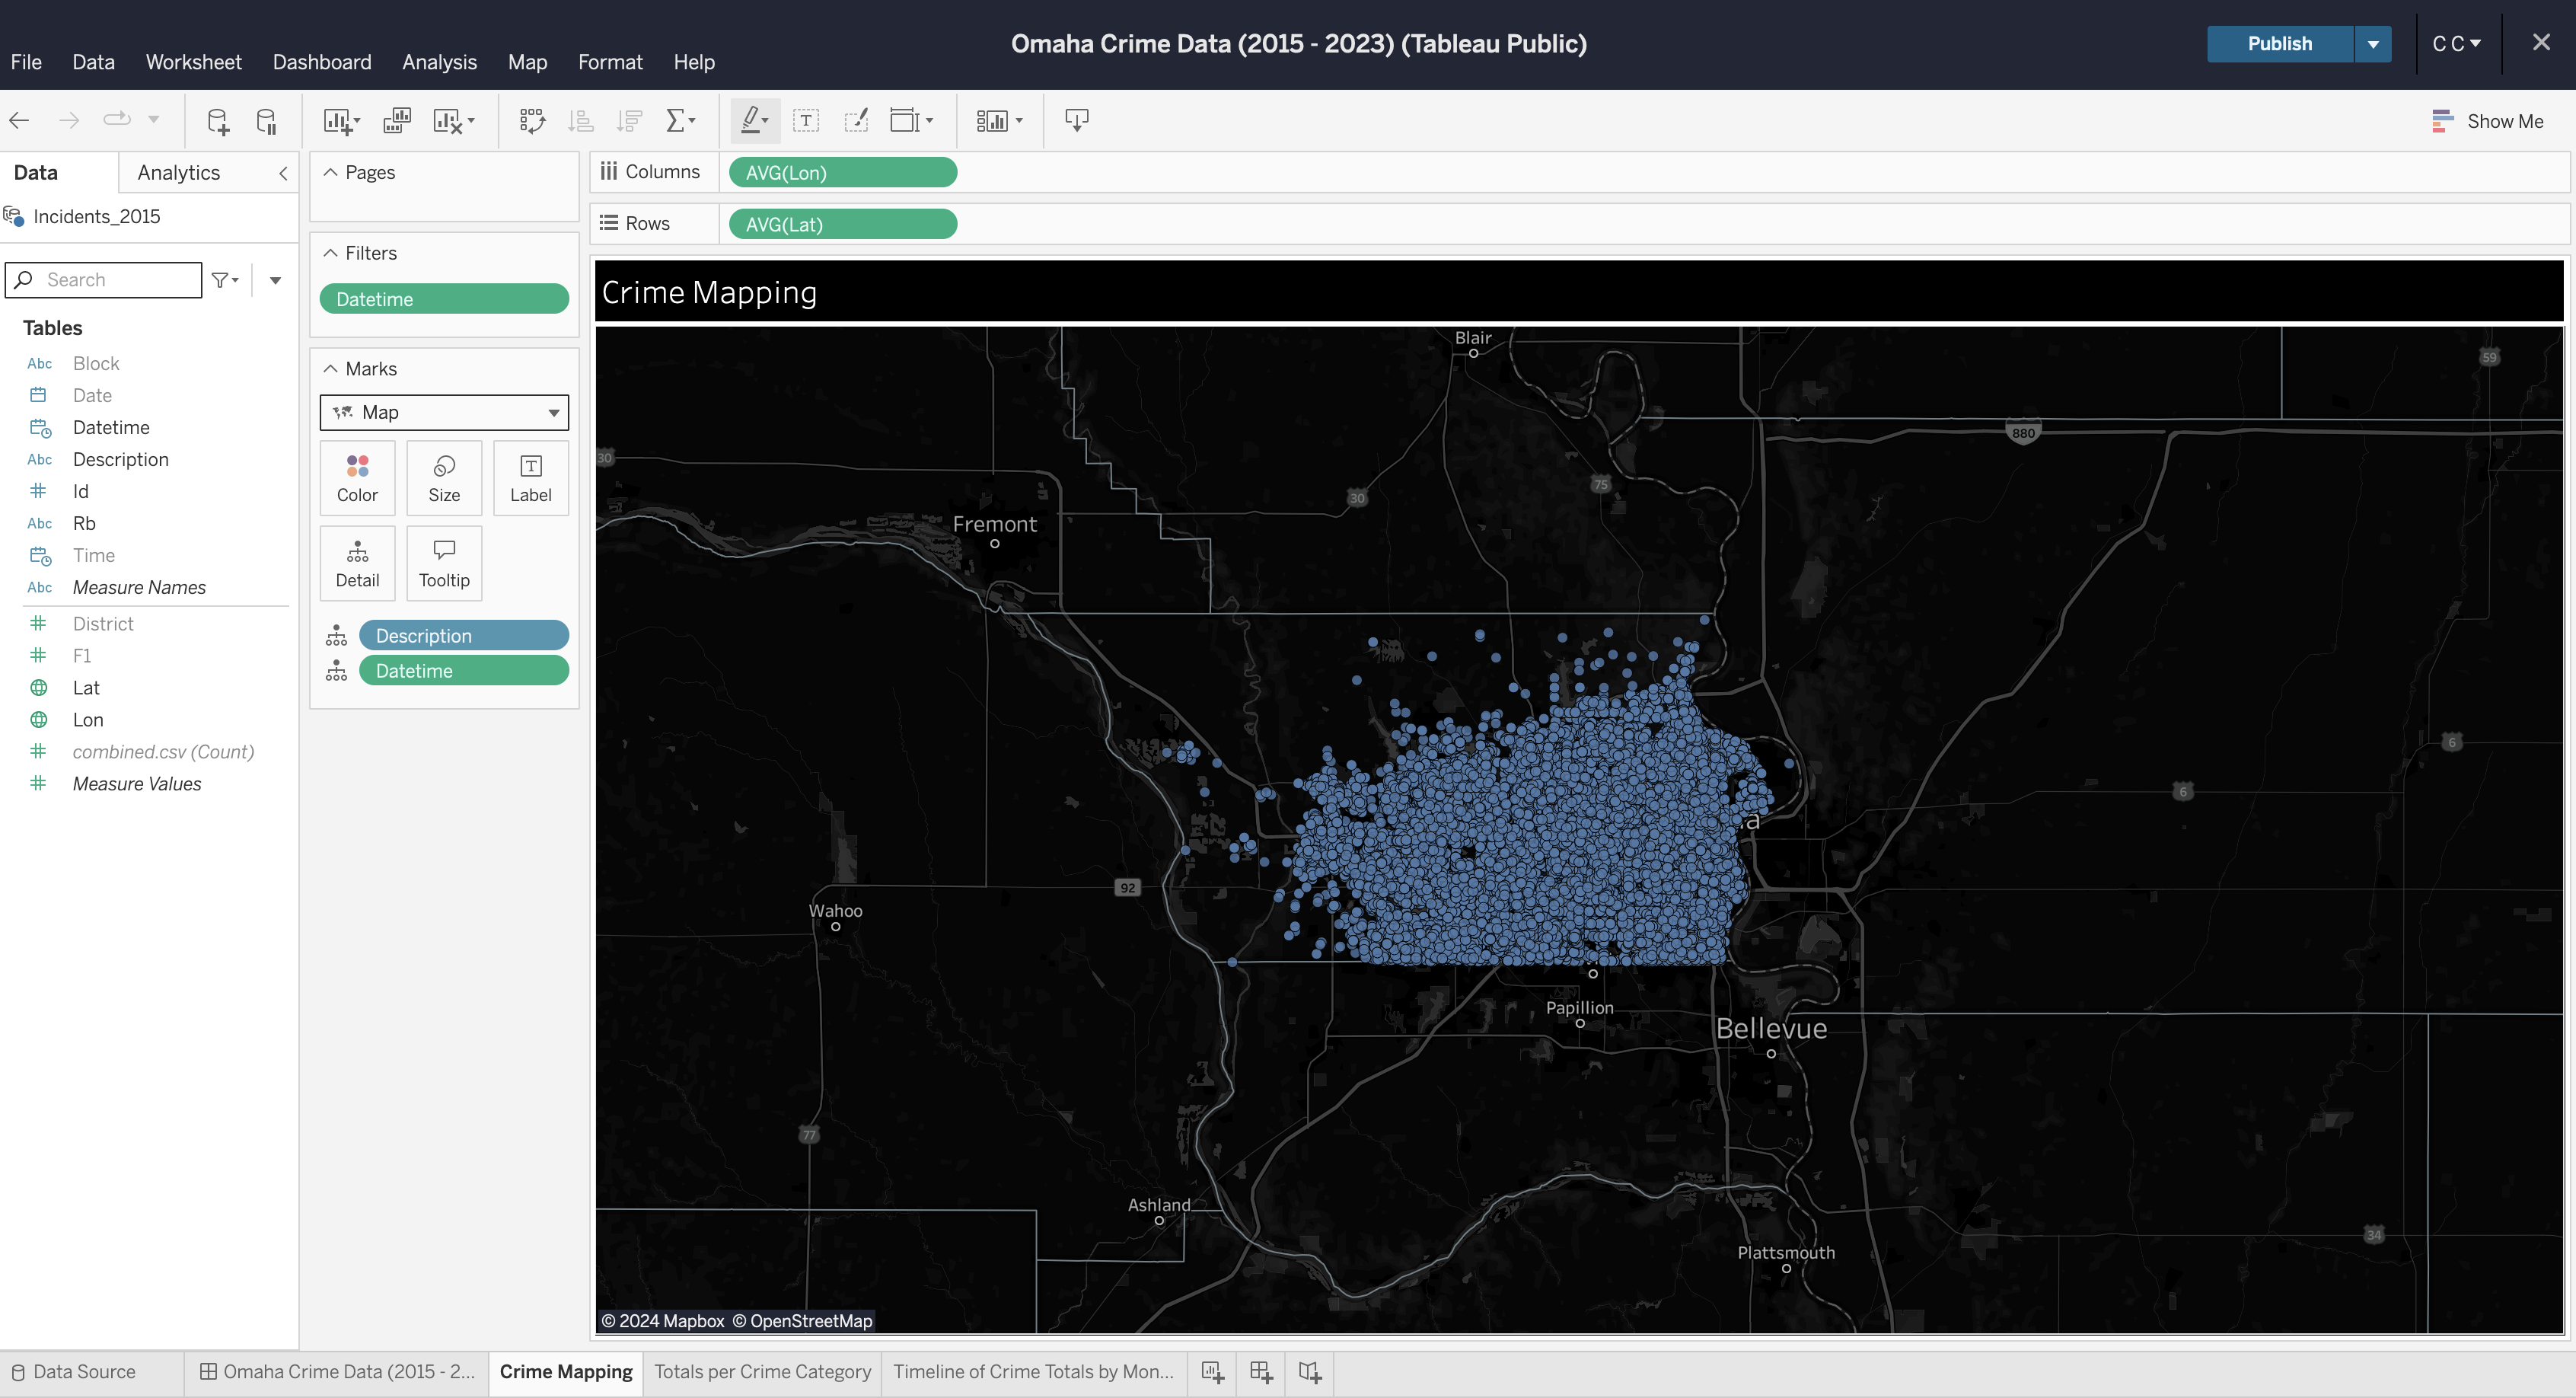 - You can repeat this process for each visualization you want to create. Explore your options by dragging data fields to different areas and by opening the field options to explore what operations can be performed on different data types @@ -143,9 +131,6 @@ To create a dashboard, click the button on the toolbar at the bottom of the screen. Within the dashboard, drag each sheet from the left side bar onto the dashboard canvas. -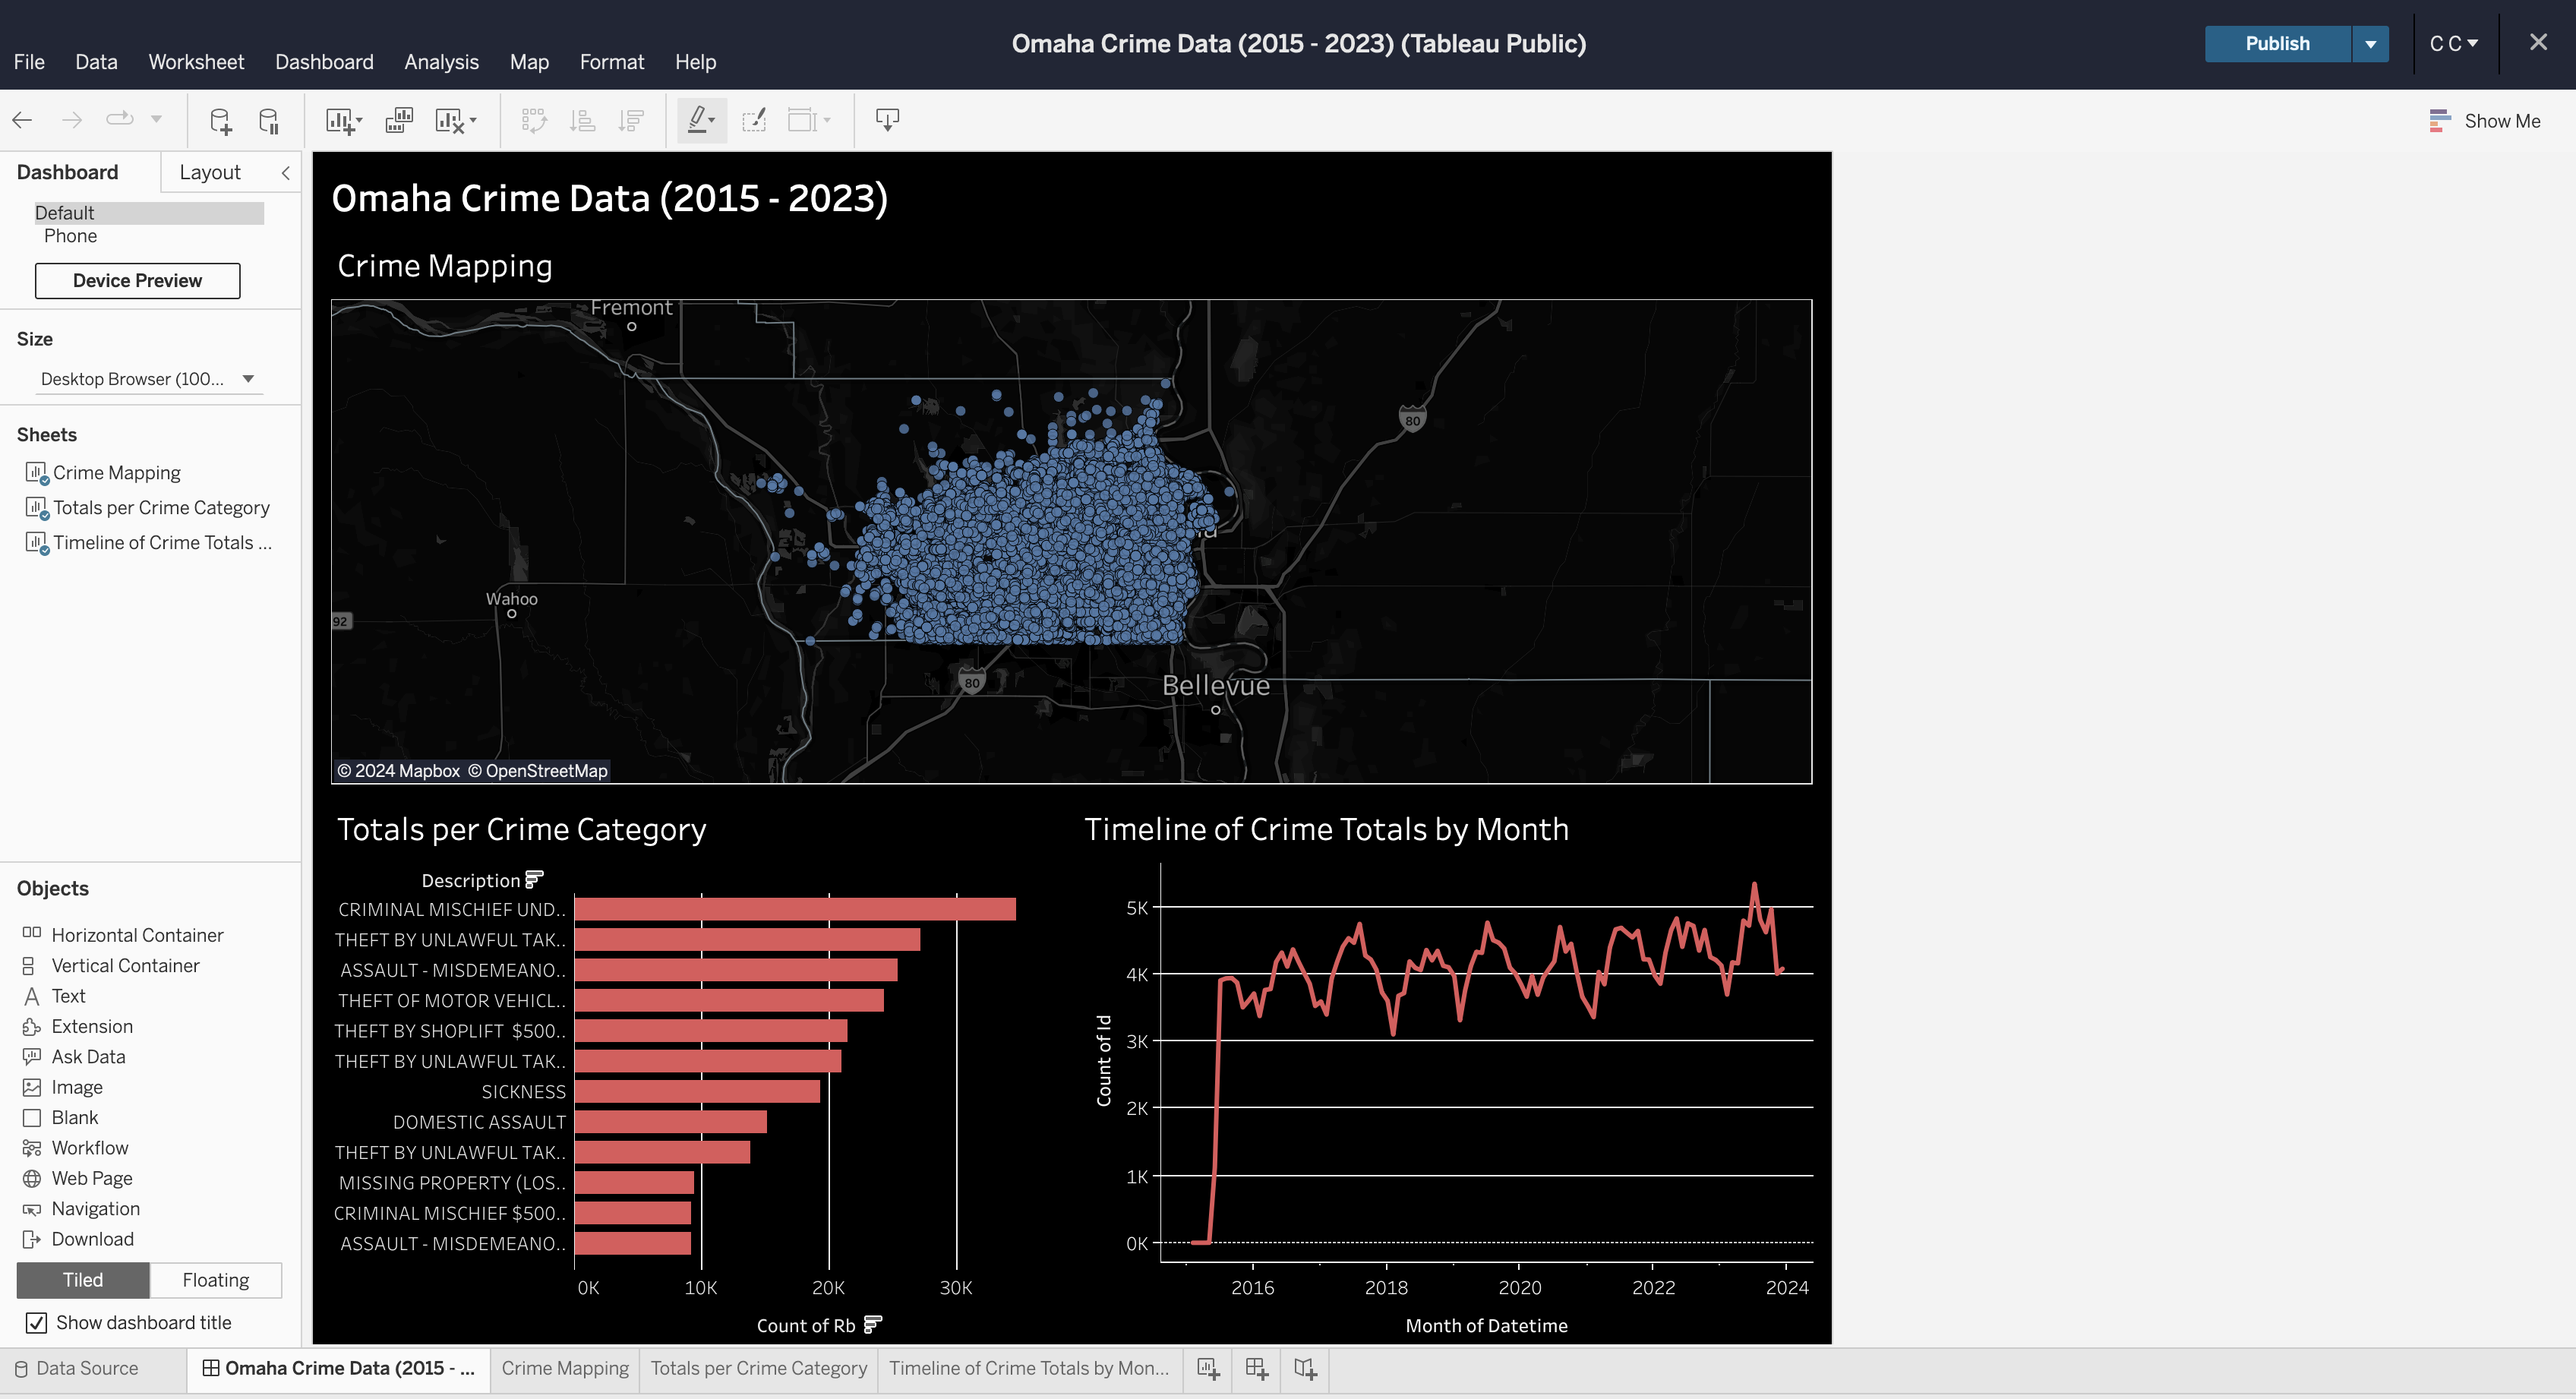 - ## Formatting You can explore a ton of different formatting options throughout the worksheets |